
More bookings do not always mean more profit. If an OTA takes 18% to 25% in commission, a room sold for $220 can leave you with less money than a direct booking at $200.
If I want to judge hotel distribution the right way, I need to look at three things at once:
- Gross performance: occupancy, ADR, and RevPAR
- Net performance: Net ADR, NRevPAR, and GOPPAR
- Market share: MPI, ARI, and RGI
That gives me a simple way to answer the big questions:
- Which channels bring volume?
- Which channels keep more money in the hotel?
- Which channels help me win against nearby competitors?
- When should I change rates, inventory rules, or channel spend?
A few points stand out fast:
- High occupancy can hide weak profit
- Booking count alone is not enough
- Channel mix matters as much as room demand
- Lead time, length of stay, cancellations, and pace all shape pricing
- Weekly reviews by stay date usually tell me more than daily swings
- A hotel at 95% occupancy can still make less than one at 80% occupancy if fees are too high
Here’s the short version: gross metrics show sales, net metrics show what I keep, and market-share metrics show whether I’m beating the comp set. That’s the framework I’d use to read hotel distribution data without getting misled by top-line numbers. Using a revenue analytics dashboard can help automate this tracking.
Core Metrics Every Distribution Report Should Include
Start with these gross metrics when you review channel performance. They give you a clean baseline. From there, you can dig into channel behavior and cost efficiency.
Occupancy Rate, ADR, and RevPAR
Occupancy rate shows what share of your available rooms sold during a given period. The formula is simple: (Rooms Sold ÷ Total Available Rooms) × 100. It measures volume, not value. A room sold at $80 counts the same as one sold at $250.
ADR adds pricing context. It shows the average rate paid per room: Room Revenue ÷ Rooms Sold. This metric tells you how much rate strength you had, but it says nothing about the rooms that stayed empty.
RevPAR pulls both ideas together: Room Revenue ÷ Total Available Rooms. It gives you a broader view than occupancy or ADR alone. But it still looks only at gross room revenue, so it leaves out the cost of getting those bookings, like commissions and other acquisition costs.
Used together, these metrics show whether results came from volume, rate, or a mix of both. Those three numbers explain how well the hotel sold rooms. The next layer is figuring out where those rooms came from. This often involves implementing specific revenue management strategies to optimize each channel.
TRevPAR and GOPPAR for a More Complete Financial Picture
If your hotel brings in meaningful ancillary revenue, such as F&B or spa sales, TRevPAR (Total Revenue Per Available Room) gives you a better read on total guest spend: Total Revenue ÷ Total Available Rooms. It helps when room revenue alone makes performance look better than it is or hides weak profit.
GOPPAR (Gross Operating Profit Per Available Room) looks at profit per available room: Gross Operating Profit ÷ Total Available Rooms. RevPAR shows what you earned. GOPPAR shows what you kept. That gap matters when OTA commissions are typically 18% to 25% of room revenue. For decision-making, GOPPAR is often the clearest metric because it tracks actual profit, not just revenue.
Comparison Table: What Each Core Metric Shows and What It Misses
| Metric | Formula | Primary Use | Main Limitation |
|---|---|---|---|
| Occupancy Rate | (Rooms Sold ÷ Total Available Rooms) × 100 | Shows room-use efficiency | Ignores the price at which rooms were sold |
| ADR | Room Revenue ÷ Rooms Sold | Shows average room rate | Ignores unsold inventory |
| RevPAR | Room Revenue ÷ Total Available Rooms | Blends occupancy and rate | Excludes ancillary revenue and acquisition costs |
| TRevPAR | Total Revenue ÷ Total Available Rooms | Includes all guest revenue | Does not account for operating costs or profit |
| GOPPAR | Gross Operating Profit ÷ Total Available Rooms | Shows profit per available room | Requires more detailed accounting |
Once you have this baseline, channel-level metrics can show where demand is strongest and where distribution costs start eating into margin.
Channel-Level Metrics: Where Bookings Come From and How They Behave
Channel metrics show which sources drove your gross results. And that matters because two channels can bring in the same number of bookings but perform very differently on revenue, dependability, and cost.
The best way to read this data is simple: start with mix and revenue, then look at timing, stay patterns, and booking dependability.
Channel Mix, Bookings, Room Nights, and Revenue
Measure each channel’s share of reservations, room nights, and gross room revenue. Those numbers often don’t match up.
For example, one channel might bring in lots of reservations but fewer room nights because stays are shorter. Another might send fewer bookings yet drive more revenue because its ADR is higher. That’s why it helps to compare each channel’s gross ADR against your property average instead of looking at booking count alone.
In North America, OTAs accounted for 48% of independent hotel bookings in 2023. At that kind of volume, even a small ADR gap can turn into a big revenue swing. Once you’ve looked at volume and revenue, the next step is to check when those bookings come in.
Lead Time, Length of Stay, and Booking Pace
Business and direct bookings often come in closer to arrival. OTA leisure bookings usually land earlier. That gap in lead time – the average number of days between booking and arrival – has a direct effect on how you handle inventory and pricing.
Average length of stay (ALOS) shifts by channel too. Leisure-focused OTAs often bring longer stays, while corporate channels tend to skew shorter. Use channel ALOS to set MLOS rules on high-demand dates so you protect revenue across the full stay, not just the busiest night.
Booking pace – how fast reservations build for a certain future date – is one of the most useful metrics in this group. If pace for a future date is running 15% ahead of the same point last year, that’s a clear sign to move rates up now. On the flip side, slow pace on a channel that usually performs well can tell you something’s off. Maybe you need targeted marketing. Maybe pricing needs a tweak. Either way, it’s a signal worth acting on.
After that, check whether those bookings turn into actual stays.
Cancellations, No-Shows, and Conversion Rates by Channel
Track cancellation and no-show rates by channel to see which sources are less dependable. If one channel cancels far more often than another, and you treat both the same in your forecast, your numbers can get messy fast.
Conversion rate shows how often a shopper becomes a booker. On OTAs, ratings, amenity detail, and photos play a big role. If conversion is low on a channel where you already have strong visibility, that usually points to a content or pricing problem, not weak demand.
It’s also smart to watch the billboard effect. OTA visibility can lift direct bookings by up to 26%, even when OTA conversion itself looks modest.
Profitability Metrics: The True Value of Each Channel
Gross revenue tells you people are booking. Net revenue tells you what the hotel actually keeps. That difference is where channel profit shows up. Once gross performance is clear, the next step is simple: how much value does each booking leave behind?
Distribution Cost Percentage, Net ADR, and NRevPAR
To figure out what a channel returns, subtract every cost tied to that booking. That means OTA commissions, metasearch spend, wholesale discounts, and any loyalty or franchise fees linked to the reservation.
From there, three metrics do most of the work:
- Distribution cost percentage = Total distribution costs ÷ Gross room revenue. This shows how much of your revenue goes right back out.
- Net ADR = (Room revenue − Distribution costs) ÷ Rooms sold. This shows what the hotel kept per room, not just what the guest paid.
- NRevPAR = Net room revenue ÷ Total available rooms. This spreads net revenue across the full room base, including unsold rooms, and gives a more honest read on what rooms are producing.
Net revenue is the starting point. Contribution margin shows what is left after variable operating costs are taken out too.
Contribution Margin and Cost Per Acquisition
Net ADR and NRevPAR remove channel commissions. Contribution margin goes one step further. It also subtracts variable operating costs like housekeeping, laundry, and utilities from net revenue. What remains is the part of the booking that helps cover fixed costs and profit.
Cost per acquisition, or CPA, sits right next to that. For directly tied costs such as reservation labor, CRS fees, and franchise charges, CPA shows the cost per booking. This is where channel comparison gets concrete fast. A direct booking at $200 with a $5 acquisition cost beats an OTA booking at $220 with a $44 commission because it keeps more net revenue.
Comparison Table: Gross Metrics vs. Net Metrics
| Metric | Gross Version | Net Version | What It Shows Differently |
|---|---|---|---|
| Room rate | ADR | Net ADR | Subtracts commissions and channel fees to show actual dollars kept |
| Revenue efficiency | RevPAR | NRevPAR | Accounts for distribution costs before dividing by available rooms |
| Operational health | Gross operating profit | GOPPAR | Measures profit after all operating and acquisition costs |
A hotel running at 95% occupancy through high-commission OTAs can end up with less gross operating profit than a hotel at 80% occupancy with 60% direct bookings. That’s the trap. High occupancy and strong RevPAR can look great on the surface while margin quietly slips away. Net metrics are what make that visible.
Once you know which channels keep more value, the next step is to compare them with the market and see whether strong net performance is also winning share.
Benchmarking, Building a Dashboard, and Turning Metrics Into Action
Market Benchmarks: MPI, ARI, RGI, and Internal Comparisons
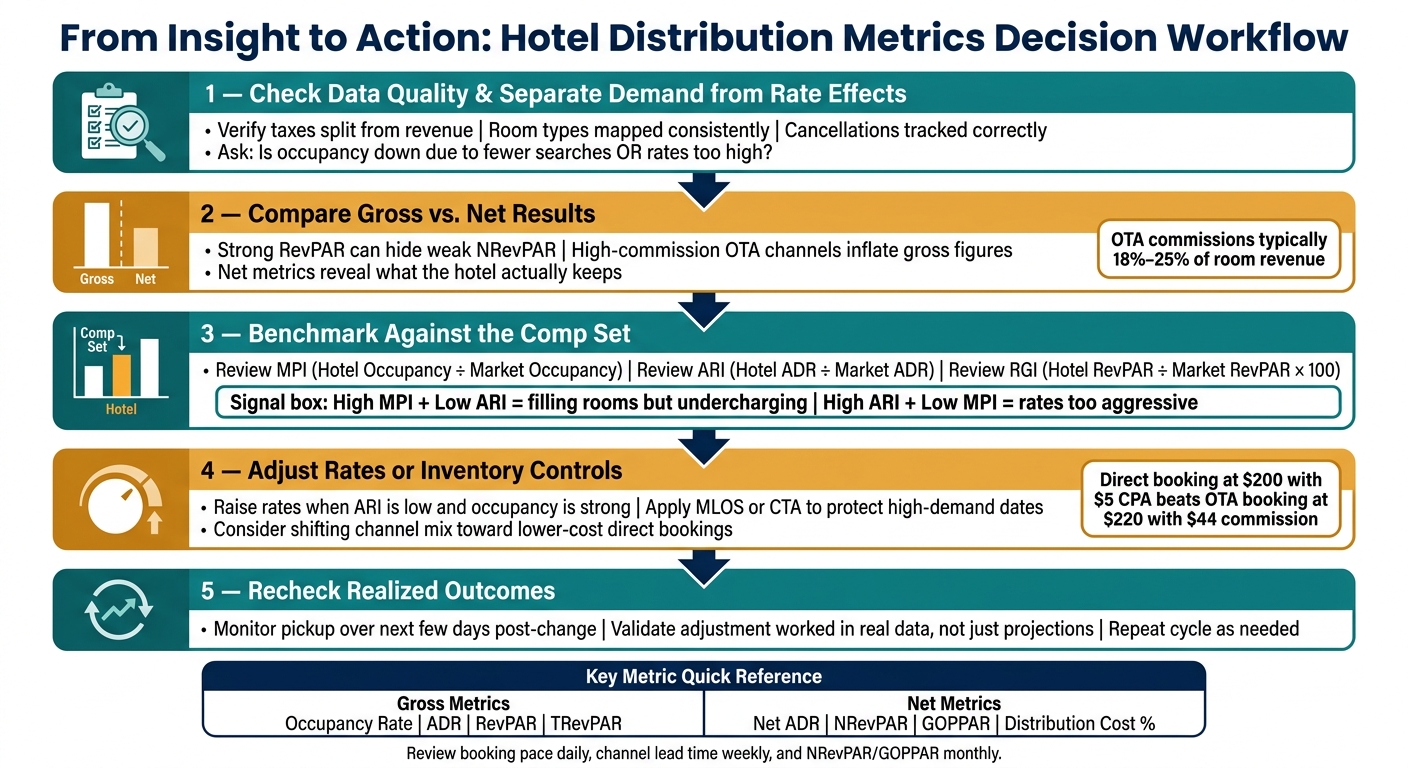
Once you know your gross and net performance, the next step is to stack those numbers against the market and act on the gap. After net performance, compare your hotel with its competitive set using MPI, ARI, and RGI. These three index scores answer one practical question: are you winning share, rate, or both?
- MPI (Market Penetration Index) = Hotel Occupancy ÷ Market Occupancy. A score above 1.0 means you’re getting more than your fair share of available guests.
- ARI (Average Rate Index) = Hotel ADR ÷ Market ADR. Above 1.0 means your rates are higher than the comp set average.
- RGI (Revenue Generation Index) = (Hotel RevPAR ÷ Market RevPAR) × 100. This is the combined view: are you winning revenue share overall?
The part that matters most is how these metrics work together. A high MPI with a low ARI usually means you’re filling rooms but not charging enough. A high ARI with a low MPI points to the opposite problem: your rates may be too aggressive, and guests are booking with competitors instead.
These market checks work best when you pair them with internal comparisons like booking pace, pickup, competitor pricing, and local event calendars. Pace helps you see whether demand is speeding up or cooling off.
A Simple Dashboard for Daily, Weekly, and Monthly Review
Each metric should tie to a clear decision, a core principle of effective revenue management. If a number doesn’t lead to action, it probably doesn’t belong on the dashboard.
| Metric | Data Source | Review Frequency | Owner | Decision Triggered |
|---|---|---|---|---|
| Booking pace / Pickup | PMS / Channel Manager | Daily | Revenue Manager | Adjust short-term pricing if pace is off |
| Occupancy, ADR | PMS | Daily | Front Office / Revenue | Flag rate or availability issues |
| Lead time by channel | Channel Manager | Weekly | Revenue Manager | Shift channel mix or adjust restrictions |
| MPI, ARI, RGI | STR / Comp set data | Weekly / Monthly | Revenue Manager | Adjust rates or marketing spend |
| NRevPAR | PMS + Cost data | Monthly | GM / Revenue | Shift channel mix to more profitable sources |
| GOPPAR, Distribution Cost % | PMS + Cost data | Monthly / Quarterly | GM / Finance | Assess operational efficiency and OTA dependency |
For multi-property groups, this setup usually needs a central reporting system. Enterprise PMS platforms that pull reporting across locations make it easier to spot cross-property patterns and manage central distribution strategies.
Use the dashboard to find the problem. Then use a simple workflow to decide what to change.
From Insight to Action: Pricing, Inventory, and Automation
When a metric moves, don’t jump straight into changing price. A short diagnostic process helps you avoid the wrong fix.
- Check data quality and separate demand effects from rate effects. Make sure taxes are split from revenue, room types are mapped the same way, and cancellations are tracked correctly. Then figure out what’s driving the change. Is occupancy down because fewer people are searching, or because your rates are too high? Those are two very different problems.
- Compare gross and net results. Strong RevPAR can hide weak NRevPAR when high-commission channels are doing most of the work. Net metrics show what you’re actually keeping.
- Benchmark against the comp set. Review MPI, ARI, and RGI before deciding something is broken.
- Adjust rates or controls. Raise rates when ARI is low and occupancy is strong. Use MLOS or CTA to protect high-demand dates.
- Recheck realized outcomes. After any change, watch pickup over the next few days to see whether the adjustment is working, not just whether it looked good in a spreadsheet.
RoomPriceGenie can automate daily pricing updates based on booking pace, demand, and competitor rates, then push those updates to the PMS or channel manager throughout the day. That gives the revenue team more time for the work that still needs human judgment: channel mix choices, contract renegotiations, and longer-term positioning. Automation should support the decision process, not replace it.
FAQs
Which hotel distribution metrics matter most?
Focus on three core KPIs: Occupancy (rooms sold as a percentage of available rooms), ADR (the average price paid per room), and RevPAR (revenue per available room).
Then go a bit deeper. Track booking pace, pickup, booking window, and channel-specific booking volume, revenue, and occupancy. Those numbers help you spot demand trends and fine-tune your channel mix.
How do I measure channel profitability?
Measure channel profitability by looking at what each platform brings in versus what it costs you. Check booking volume, total revenue, and occupancy for every channel.
Also include commissions and fees. For OTAs, those charges usually fall between 18% and 25%. That gives you a clearer picture of which channels bring in the best net return.
RoomPriceGenie can help here by optimizing pricing and tracking performance data through PMS and channel manager integrations.
How often should I review distribution metrics?
Review distribution metrics on a regular basis and keep them current. Check channel and listing details often so rates, availability, and property information stay accurate.
Build forecasts every month, then update them at least once a week to match current conditions. It also helps to audit key channels on a regular schedule to make sure all inventory is available and to avoid rate or availability mismatches, especially on top-performing channels.