

If I only check one ADR view, I can miss a pricing problem. I need to read ADR against concurrentieprofiel, market median, season, day of weeken booking window to see whether my rate gap comes from pricing, timing, or demand.
Hier volgt de korte versie:
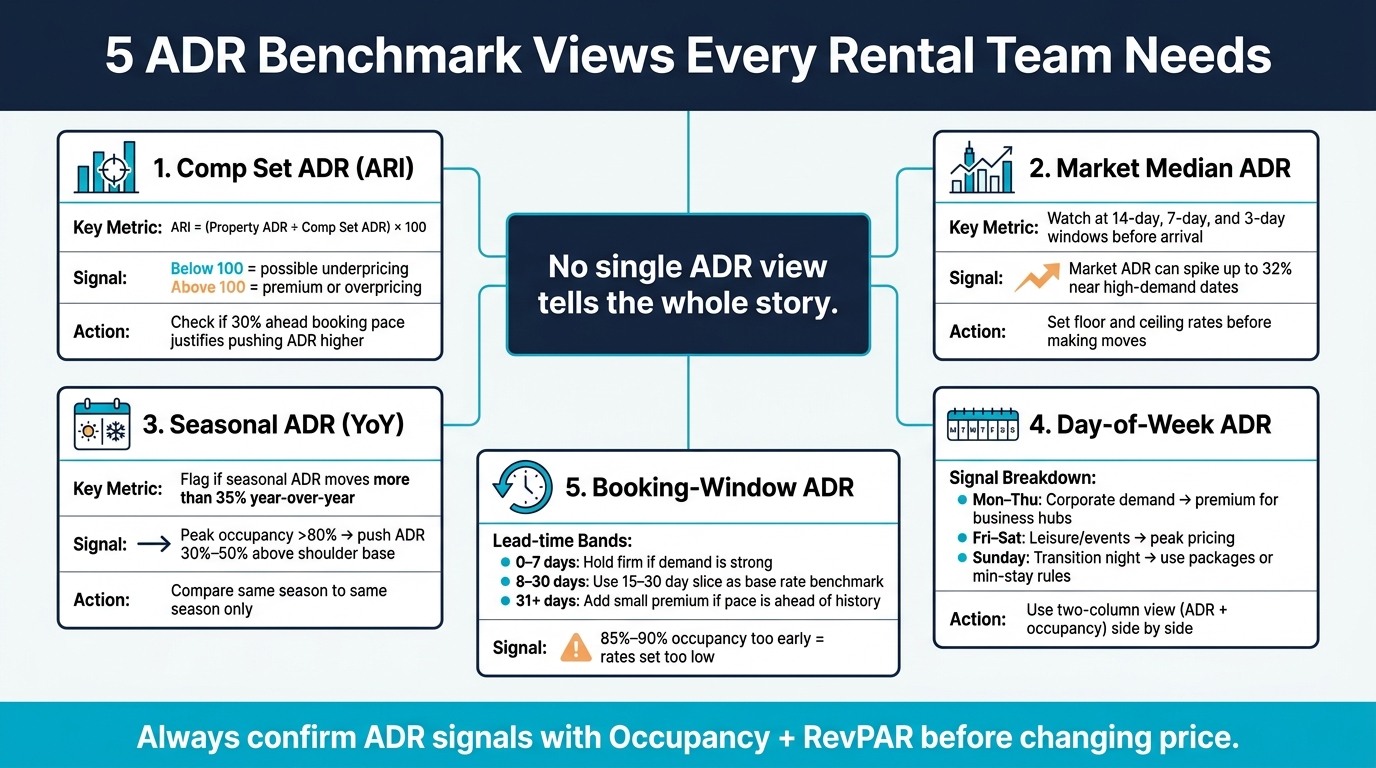
- Comp set ADR shows whether I’m above or below close rivals through ARI
- Market median ADR shows where my rates sit in the local market
- Seasonal ADR helps me spot year-over-year swings, especially when rates move more than 35%
- Day-of-week ADR shows which nights carry rate strength or weakness
- Booking-window ADR shows whether pricing gaps start at 31+ days, 8–30 dagen, of 0–7 dagen
- I should not read ADR alone; I need to check it next to bezetting en RevPAR
A few numbers matter right away. If booking pace is 30% vooruit of last year, I may have room to charge more with dynamic pricing. If market ADR jumps as much as 32% close to arrival, I need to watch the 14-day, 7-day, and 3-day windows. And if I hit 85%–90% occupancy too early, my rates may be too low.
Snelle vergelijking
| Benchmark view | What I use it for | What a gap may mean |
|---|---|---|
| Comp set (ARI) | Check direct pricing position | Below 100 can mean underpricing; above 100 can mean premium pricing or rates set too high |
| Market median | Check my place in the local market for apartments | Shows whether my gap is only vs. rivals or market-wide |
| Seasonal YoY | Compare the same season year over year | Large swings can point to demand shifts or pricing errors |
| Dag van de week | Check rate by night | Helps me find weak weekdays, peak weekends, or soft Sundays |
| Boekingsvenster | Check timing of rate moves | Shows whether I am too cheap early or too soft close to arrival |
The main point: I use these five views together, then confirm the signal with occupancy and RevPAR before I change price.
1. Property vs. Comp Set ADR
Start by comparing your ADR with a comp set made up of properties travelers would actually book instead of yours. That usually means hotels with a similar location, property type, amenities, and rating level. The main metric here is Average Rate Index (ARI), which is calculated as (Property ADR ÷ Comp Set ADR) × 100. An ARI above 100 means your rates sit above the comp set average. An ARI below 100 means they sit below it. [1]
This is the quickest way to see if your property is out in front of, or trailing, its direct substitutes on the dashboard. A sub-100 ARI isn’t always bad news. But if you’re not discounting on purpose, it often points to underpricing. Before you change rates, check occupancy and booking pace. [1]
For example, if future booking pace is 30% vooruit of the same period last year, that’s a strong sign you should push ADR higher instead of keeping rates flat. [2]
It also helps to include one or two rate leaders in your comp set. That gives you a clearer view of the top end of what guests in your area are willing to pay. [3]
Next, compare your ADR with the market median to figure out whether the gap is only showing up against your comp set or across the market as a whole.
2. Property vs. Market Median ADR
Comp set ADR tells you how your property stacks up against close substitutes. Market median ADR gives you a broader read on where your rates sit across the market. ARI helps you tell whether the gap is meaningful or just random fluctuation. [3]
The rule here is simple: an ARI above 100 means your rates sit above the market benchmark. An ARI below 100 can point to underpricing, unless that lower rate is a deliberate choice. [1]
If your dashboard shows a single ADR for the whole property, break it out by room type before you compare anything. A standard room and a suite shouldn’t be lumped together if you want a fair read. [5][4]
It also helps to watch market median ADR at a few points before arrival:
- 14 days out
- Nog 7 dagen te gaan
- 3 days out
That closer-in booking window matters because demand tied to events and holidays can push market ADR up fast – by as much as 32% near high-demand dates. [2] That short-window view then becomes your baseline for seasonal ADR benchmarking.
Before shifting into seasonal ADR benchmarks, set floor and ceiling rates so any price moves stay within a controlled range. [2]
3. Seasonal ADR Benchmarks
Seasonal ADR works best when you compare the same season year over year. Put this summer next to last summer, not against winter or spring. That’s how you spot actual rate movement instead of getting misled by normal seasonal swings.
If seasonal ADR moves more than 35% YoY, flag it. That kind of jump can point to a market change or a pricing mistake.
| Season | Occupancy Signal | Recommended ADR Action |
|---|---|---|
| Piek | Projected occupancy above 80% | Push ADR 30%–50% above shoulder base rates |
| Shoulder | Moderate demand | Hold near base rate |
| Laag | Soft pickup and high vacancy | Set a floor based on contribution margin |
Treat these bands as relative ranges, not fixed pricing rules. They’re guardrails, not a set-it-and-forget-it playbook.
On peak days, read ADR alongside occupancy. High ADR + low occupancy often means you’ve priced too high. Low ADR + high occupancy usually means you left money on the table.
Around major events, use a 14-7-3 review cadence to catch late demand spikes. And on peak weekends, add regels voor minimale verblijfsduur to protect ADR and cut turnover.
From there, break seasonal patterns down by day of week to see which nights are actually moving the rate change.
4. Day-of-Week ADR Benchmarks
Look at day-of-week ADR against your past results and your comp set. That helps you tell whether a rate change is adding revenue or simply moving demand around.
City and business-focused properties tend to post their strongest ADR from Monday through Thursday because of corporate travel. Leisure and resort properties often get their best rate on Friday and Saturday. Sunday usually works as a transition night, which is where packages or minimum-stay rules can help protect occupancy.
| Day Range | Primary Demand Driver | ADR Strategy |
|---|---|---|
| Maandag–donderdag | Corporate/business travel | Premium rates for business hubs; comp set ARI focus |
| Vrijdag–zaterdag | Leisure, events | Peak pricing; watch market median |
| zondag | Transition/leisure | Use packages or minimum-stay rules to protect occupancy |
A simple two-column dashboard works well here: one column for ADR, one for occupancy, both broken out by day. That side-by-side view makes the story a lot clearer. You can spot whether a rate move is lifting revenue, or whether ADR is going up while occupancy starts to slide.
After those day-of-week patterns come into focus, compare ADR by booking window. That shows how far ahead your rate changes are starting to appear.
5. Booking-Window ADR Benchmarks
After day-of-week patterns, booking-window ADR shows wanneer rate changes are taking hold. It helps you see if rates are being set at the right lead time, not just at the right level. A simple way to read it is to split reservations into 0–7 dagen, 8–30 dagenen 31+ days. That makes it easier to spot where pricing pressure begins.
De 15–30 day slice is the clearest read on base rate because it blends leisure and business demand. ADR in this band should sit close to your base rate. If it falls below that range, you may be underpricing unless that lower rate was planned on purpose.
De 0–7 day window is where many teams cut rates too fast. It often happens out of habit, not data. Close-in dates at peak demand can end up underpriced when teams react late. During peak periods, review these dates every day so you can catch late demand spikes before rates slip.
Voor 31+ day bookings, fast pickup at a low rate usually points to an open period that was priced too softly. If booking pace is ahead of history, add a small early-booking premium. Reaching 85% to 90% occupancy too far ahead of arrival is often a sign that pricing was set too low [6].
Use booking-window ADR to see whether gaps open early, tighten late, or stay flat across the booking curve. For more advanced tactics, check out our revenue management blog.
| Doorlooptijdband | ADR Signal | Aanbevolen actie |
|---|---|---|
| 0–7 Days | Low price sensitivity if demand is strong | Hold firm; discount only if occupancy is well below target |
| 8–30 Days | Mixed demand | Use 15–30 days as the benchmark; track pickup against pace |
| 31+ Days | Low to moderate price sensitivity | Stay near base rate; add a small premium if pace is ahead |
Read these lead-time gaps next to the other benchmark views to figure out whether the issue is timing, price level, or both.
How to Read ADR Gaps Across Benchmark Views
After you review the five views, look at them together. That’s how you can tell whether an ADR gap is structural, seasonal, or just tied to timing. Put simply, these views help you decide if the gap comes from market position, booking pace, or a plain pricing mistake.
| Benchmark View | Best Use | Belangrijkste beperking | Typisch signaal |
|---|---|---|---|
| Comp Set (ARI) | Use when you want the clearest read on direct pricing position | Competitors may have different room mixes or goals [3] | Above 100 ARI: premium positioning or overpricing; below 100 ARI: underpricing or a deliberate market-share move [1] |
| Market Median | Use when you want a broader sense of whether the property is priced above or below the market | Less specific to your property’s own niche | Above: niche or luxury positioning; below: lower-rate positioning |
| Seasonal (YoY) | Use to check whether the gap is seasonal or structural | Ignores new supply or shifted event dates | Above: stronger demand or higher yield; below: weaker demand or lost share |
| Day-of-Week | Use to spot night-by-night pricing distortion | Can be skewed by one-off local events | Above: rate may be blocking occupancy on peak nights; below: missed premium on peak nights |
| Boekingsperiode | Use to find out whether the gap shows up early or late in the booking curve | Requires clean historical PMS data | Above early: pricing too high for early demand; below late: pricing too low near arrival |
Once you identify the view, don’t change price right away. First, check occupancy and RevPAR versus TRevPAR versus GOPPAR to see if the signal holds up.
Read ADR gaps alongside occupancy and RevPAR. Above-benchmark ADR with rising RevPAR usually points to healthy premium pricing. Above-benchmark ADR with falling occupancy is a warning sign that rates may be too high. The gap only means something when rate, occupancy, and RevPAR all move in the wrong direction at the same time.
Conclusie
No single ADR view gives you the whole picture. You need to look at comp set, market median, seasonal, day-of-week, and booking-window benchmarks together to see what’s going on. That’s how you tell whether a gap is built into your pricing, tied to seasonality, or caused by timing.
When ADR, occupancy, and RevPAR point in the same direction, the rate decision is pretty straightforward. When those signals clash, pause and dig in before you change price. That alignment helps you confirm the move or decide to hold rates where they are.
The goal isn’t to chase every gap. It’s to know which gaps are intentional and which ones are quietly costing you. RoomPriceGenie geautomatiseerde prijsbepaling for hotels using booking data and live local demand, so your rates stay in line with these benchmarks without the manual work.
FAQs
What is a good ARI score?
Een ARI above 100% means your property is beating its compset. That can point to smart pricing, a stronger value proposition, or both.
Een ARI below 100% means you’re bringing in less than your compset. Sometimes that’s intentional if you’re chasing market share. Other times, it’s a sign your rooms may be priced too low.
To calculate ARI, divide your property’s ADR by your compset’s ADR for the same time period, then multiply the result by 100.
How often should I review ADR benchmarks?
Review ADR at more than one level. Check it daily so you can see if your pricing is working and react fast when the market shifts.
Then step back on a regular schedule with broader reviews, like quarterly check-ins. That helps you assess market changes and measure long-term progress.
If you use automated revenue management tools, lean on real-time data for fast adjustments. Then use reporting analytics to fine-tune your strategy over time.
Which ADR view matters most?
No single ADR view tells the full story. You get a much better read when you look at ADR next to occupancy and RevPAR, because ADR on its own can point you in the wrong direction.
A simple two-column dashboard that compares ADR and occupancy by day of week and room type can make those patterns easier to spot. It helps show when it makes sense to push rates higher and when it’s smarter to fill more rooms to get the most net revenue.