


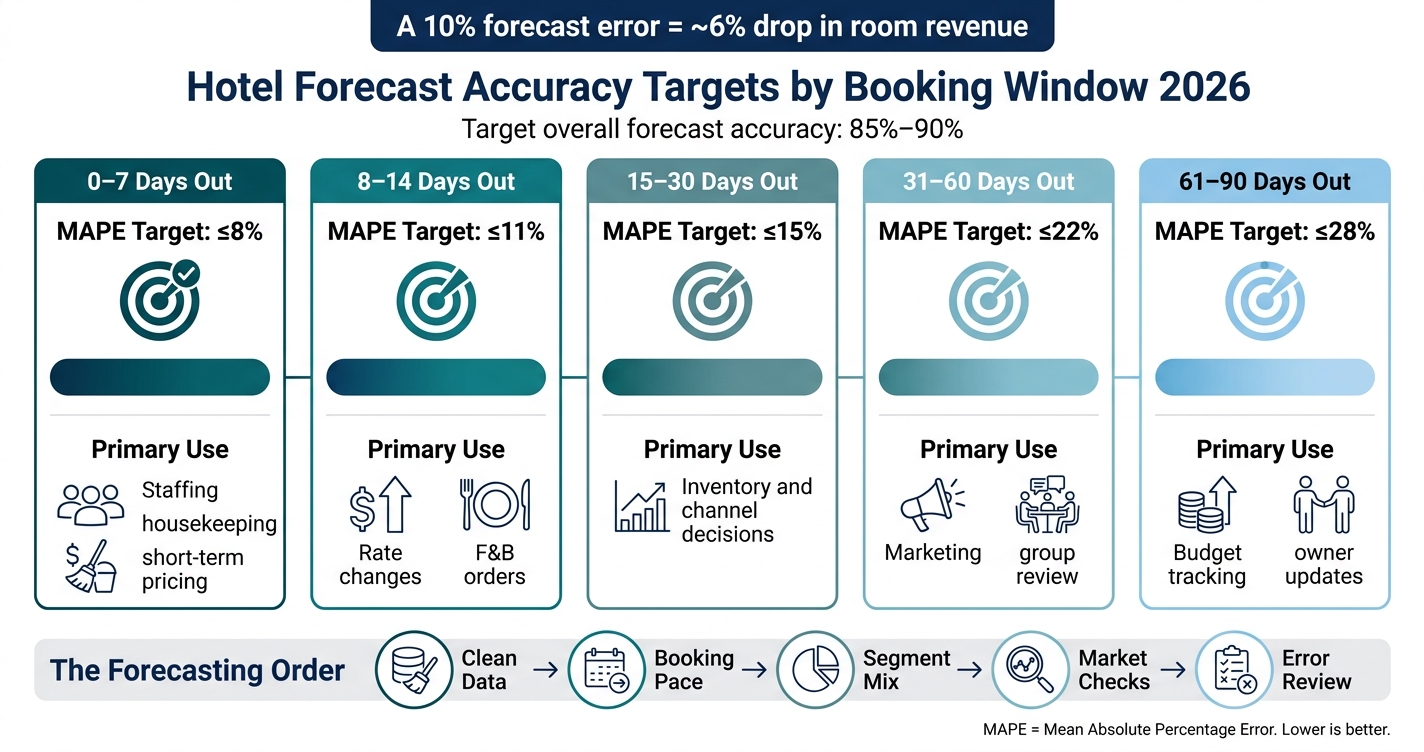
Si mi previsión para el hotel se desvía en 10%, los ingresos por habitaciones pueden bajar unos 6%. Así que en 2026 me centraría en un objetivo: crear un proceso de previsión que se mantenga cerca de Precisión del 85% al 90% y se va complicando cada vez más según el plazo de reserva.
Aquí tienes un resumen de lo que haría:
- Lleva un control de las cifras que importan: tasa de ocupación, tarifa media diaria (ADR), ingresos por habitación disponible (RevPAR) e ingresos por habitación
- Mide el error como es debido: mantener MAPE bajo 10% siempre que puedas y presta atención al sesgo de las previsiones
- Establece objetivos por intervalos de tiempo: Los próximos 7 días deberían ser mucho más ajustados que los que quedan entre 60 y 90 días
- Limpia primero las entradas: PMS, CRS, cancelaciones, ausencias, segmentos y canales
- Utiliza un historial de 24 meses: pero sin contar las adquisiciones, los cierres y los periodos atípicos
- Previsión por segmentos: Las reservas directas, a través de OTA, corporativas y de grupo no se hacen de la misma manera
- Consulta el ritmo de reservas por plazo de entrega: desde 0 a 3 días antes hasta más de 61 días antes
- Incorpora las señales del mercado: eventos locales, capacidad de vuelos, demanda de búsquedas y agotamiento de plazas de la competencia
- Revisa el error de previsión cada semana: compara las previsiones a 90, 60, 30, 14 y 7 días con los resultados reales
- Aprovecha los errores para ajustar los precios: Si la demanda crece más rápido de lo esperado, cambia las tarifas y los controles cuanto antes
Hay una regla sencilla que te puede ayudar: Primero limpiar los datos, luego el ritmo, después la combinación de segmentos, a continuación las comprobaciones de mercado y, por último, la revisión de errores. Eso me da una previsión que puedo usar para fijar precios, gestionar la plantilla, controlar el presupuesto y presentar informes a los propietarios sin tener que ir a ciegas.
Ventana de previsión y objetivos de MAPE
| Ventana de previsión | Un buen objetivo de MAPE | Uso principal |
|---|---|---|
| 0-7 días | 8% | Personal, limpieza, tarifas para estancias cortas |
| De 8 a 14 días | 11% | Cambios en las tarifas, pedidos de comida y bebida |
| 15–30 días | 15% | Decisiones sobre el inventario y los canales de distribución |
| 31–60 días | 22% | Marketing y revisión en grupo |
| 61–90 días | 28% | Seguimiento del presupuesto y comunicaciones con los propietarios |
Si quiero que las previsiones sean más precisas en 2026, no necesito empezar por un modelo más complejo. Lo que necesito es un proceso claro y repetible que me muestre cómo evoluciona la demanda y en qué aspectos mis cifras siguen fallando.
Previsiones para hoteles: 4 formas de simplificarlas y optimizarlas
Paso 1: Crea una base de datos limpia para las previsiones
Antes de cambiar de modelo, limpia primero los datos de entrada.
Revisa los datos diarios de tu PMS, CRS y fuentes de canal
Cada día, revisa estos ocho aspectos clave: fecha de estancia, fecha de reserva, habitaciones vendidas, tarifa media diaria (ADR), cancelaciones, ausencias, segmento y canal[1]. Si falta o no cuadra aunque sea un solo campo, la previsión empieza a desviarse.
Usa un mismo formato de fecha en todos los sistemas, como por ejemplo MM/DD/AAAA[2]. Si los formatos no coinciden, el modelo empieza a rellenar los huecos con suposiciones erróneas. Haz lo mismo con las etiquetas de los segmentos. Si una fuente de demanda aparece bajo varios códigos, tus datos combinados se desordenan enseguida.
Conócenos De 6% a 8% de reservas registradas incluyen errores como reservas fantasma, bloques duplicados o ausencias antiguas [1]. Eso ya es más que suficiente para que las previsiones de ocupación se vayan al traste.
Crea una línea de referencia histórica de 24 meses
Tira al menos 24 meses de historia diaria para que puedas detectar tendencias a largo plazo y ciclos de demanda recurrentes [2][3]. Pero no incluyas esos datos históricos directamente en la previsión. Primero, elimina las distorsiones, como las adquisiciones totales, los cierres temporales y cualquier otro periodo de funcionamiento que se salga de lo normal. Si los dejas, la línea de referencia se desvía.
Usa STLY como punto de partida, a menos que el ritmo actual sea claramente el más adecuado [3]. Así tendrás una base clara para trabajar el ritmo y la mezcla en el siguiente paso.
Usa una tabla de limpieza de datos antes de hacer previsiones
Corrige los errores más comunes antes de hacer tus previsiones:
| Problema con los datos | Efecto de distorsión | Medidas correctivas |
|---|---|---|
| Reservas corporativas con códigos erróneos | Da una imagen errónea de la demanda del segmento y de la sensibilidad al precio [2] | Reasigna las reservas a las etiquetas de segmento correctas según el código de tarifa |
| Lavado en grupo no registrado | Sesgo positivo; exagera la demanda y ahuyenta a los clientes de paso [3] | Aplica los factores de ajuste de los últimos 12 meses por tipo de grupo (por ejemplo, 8–12% para bodas, 4–8% para eventos corporativos) |
| Reservas duplicadas | Exagera artificialmente las previsiones de ocupación y RevPAR [1] | Ejecuta cada noche consultas SQL para marcar las reservas con el mismo nombre de huésped y la misma fecha de llegada |
| Ausencias sin justificación | Impide que las existencias se revendan y distorsiona la referencia histórica [1] | Borra el estado de «no se ha presentado» cada mañana, una vez que haya pasado la fecha de llegada |
| Bloques de grupo no liberados | Mantiene las habitaciones reservadas más allá del plazo de reserva, lo que provoca pérdidas | Establece y aplica las fechas de salida en el PMS y el CRS |
Aquí basta con una simple división:
- Asignar comprobaciones diarias de los datos para las reservas
- Asigna el resumen semanal al responsable de ingresos o director general
Una vez que los datos están limpios, es mucho más fácil interpretar el ritmo de reservas y la composición por segmentos en el paso 2.
Paso 2: Afina la previsión teniendo en cuenta el ritmo de reservas, el plazo de entrega y la composición por segmentos
Una vez que tengas los datos depurados, utiliza el ritmo de reservas y los patrones de segmentos para pronosticar la demanda de habitaciones día a día.
Usa las curvas de ritmo de reservas y de recogida por fecha de estancia
Un punto de partida sencillo sería algo así:
Habitaciones previstas = Reservas confirmadas (OTB) + aumento previsto según las curvas de tendencia históricas[1].
Compara tu ritmo actual con el del mismo día de la semana y la misma estación de años anteriores. Así podrás ver con mayor claridad si la demanda está aumentando como se esperaba o si se está desviando del rumbo. Si el repunte dura más de ±5% Si te estás adelantando o retrasando respecto al plan durante un periodo de gran demanda, revisa bien tus tarifas o restricciones [1].
Haz un seguimiento de la recogida usando intervalos de plazo de entrega:
- 0–3 días
- 4–7 días
- De 8 a 14 días
- 15–30 días
- 31–60 días
- A más de 61 días vista
Actualiza esas curvas cada trimestre para reflejar los cambios estacionales [3].
Pace te dice ¿A qué velocidad? La demanda va en aumento. La composición por segmentos te indica dónde de dónde viene esa demanda.
Previsión por segmentos en lugar de una cifra global
Una previsión combinada puede ocultar lo que realmente está pasando. Lo mejor es hacer previsiones por separado de la demanda transitoria directa, de las OTA, corporativa y de grupos. [2][4].
¿Por qué es importante esto? Porque estos segmentos no se comportan igual.
Las reservas a través de OTA suelen cancelarse más que las reservas directas [3]. Los huéspedes de negocios suelen reservar más cerca de la fecha de llegada y les importa menos la tarifa, mientras que los que viajan por placer suelen reservar con más antelación y se ven más afectados por los cambios en los precios [2].
Esa diferencia cambia la forma en que interpretas el ritmo. Una noche de alojamiento contabilizada en una cuenta corporativa no es lo mismo que una noche de alojamiento de una reserva hecha a través de una OTA con 30 días de antelación.
Tabla de plazos de entrega y acciones por segmento
La tabla que aparece a continuación relaciona los plazos de entrega con el comportamiento del segmento que probablemente observes y la acción que suele seguir a ello. Úsala como referencia habitual en tu revisión diaria o semanal.
| Intervalo de plazo de entrega | Segmento común | Comportamiento a la hora de reservar | Medidas de previsión |
|---|---|---|---|
| 0-3 días | Sin reserva previa / Ocio de última hora | La sensibilidad al precio es baja si la demanda es fuerte; alta si es débil | Mantén las tarifas sin cambios si el ritmo va por delante; aplica descuentos solo si la ocupación está muy por debajo del objetivo |
| De 4 a 7 días | Ocio de última hora | Alta sensibilidad al precio | Usa pequeños descuentos o ventajas adicionales solo si el ritmo va muy por debajo del objetivo |
| De 8 a 14 días | Los que planifican con poca antelación | Sensibilidad moderada | Estate atento a si el repunte se desvía del ritmo previsto; haz pequeños movimientos a la baja solo si el repunte se debilita |
| De 15 a 30 días | Viajes de ocio y de negocios habituales | Sensibilidad moderada | Mantén los tipos cerca del nivel básico; considera esto como el periodo de referencia |
| 31–60 días | Los que se organizan con antelación / Grupos pequeños | De bajo a moderado | Mantén las tarifas básicas; revisa los precios por grupo y refuerza los controles para las fechas de mayor demanda |
| Más de 61 días | Grupos grandes / Gente que planifica con mucha antelación | Baja sensibilidad | Aplica los factores de ajuste históricos según el tipo de grupo; ten en cuenta unas pequeñas bonificaciones por reserva anticipada si el ritmo va por delante de lo previsto |
Para los bloques de grupo, aplica los factores de lavado históricos de tu property. Configura alertas para cualquier bloque que muestre más de Historial de lavados del 20%[1].
Paso 3: Adáptate a la demanda del mercado, a los eventos locales y a la complejidad de Multi-Property
Los datos históricos sobre el ritmo de ventas ayudan, pero no reflejan todos los cambios en la demanda. Por eso necesitas señales de mercado en tiempo real, además de tu historial. Así podrás convertir esas señales en precios diarios y prever cambios con un calendario de eventos en tiempo real.
Mantén un calendario de eventos y de la oferta local
Piensa en tu calendario de eventos como una herramienta dinámica para calcular las fechas de estancia, no como una lista estática. Para cada evento, anota el nombre, el tipo de evento, el aumento de demanda previsto y el impacto que ha tenido en el pasado en la ocupación y el precio medio por habitación (ADR), comparándolo con una fecha similar en la que no hubiera ningún evento.
En el caso de los eventos recurrentes, compara esas fechas de estancia con las fechas en las que no hay eventos en el mismo mes de los últimos dos o tres años. En los mercados estadounidenses, hay algunos periodos que distorsionan la demanda con tanta frecuencia que necesitan sus propias etiquetas:
- Día de los Caídos
- 4 de julio
- Día del Trabajo
- Acción de Gracias
- Navidad
- Año Nuevo
- Vacaciones de primavera y de invierno según el distrito escolar local
- los fines de semana de las fiestas de bienvenida y de graduación de la universidad
- eventos que atraen a mucha gente en toda la ciudad, como maratones, grandes convenciones y conciertos importantes
Compara esas fechas con las semanas del mismo mes en las que no hubo eventos. No las compares con la misma semana del año pasado, porque esa semana también podría haber estado distorsionada.
Unos estudios sobre los hoteles de Indianápolis revelaron que los días en los que se celebraban convenciones aumentaban la tarifa media diaria (ADR) en unos $19,93, o 20,7% por encima de la tarifa media diaria, y elevaban la ocupación en 13,1 puntos porcentuales. [6]. Un simple aumento interanual no reflejará ese salto.
Usa las señales de demanda externa sin complicar demasiado el proceso
No te compliques con esto. Elige entre tres y cinco indicadores externos y revísalos en tu reunión semanal de previsiones. Algunos buenos ejemplos son la capacidad de las aerolíneas que llegan a tu aeropuerto más cercano, el volumen de búsquedas en Internet sobre tu destino y el agotamiento de plazas de la competencia o los subidas bruscas de precios.
Los datos de búsquedas y vuelos pueden reflejar la demanda hasta 365 días antes de la llegada, con un aumento notable unos 170 días antes en el caso de los viajes de ocio y a eventos programados [5]. Así que, si los asientos de los vuelos de llegada para un fin de semana concreto han subido 20% respecto al año pasado, pero tu previsión sigue indicando un fin de semana normal, vale la pena echarle un vistazo más de cerca. No es algo que se descarte automáticamente. Es una señal para investigar.
La clave está en la coherencia. Estas señales solo sirven de algo si todos los property las interpretan de la misma manera.
Estandarizar el proceso de previsión del grupo
En el caso de los grupos «multi-property», el mayor problema a la hora de hacer previsiones no suele ser el modelo en sí, sino las definiciones incoherentes.
Si un property clasifica las tarifas negociadas para empresas en la categoría “transitorias” y otro las registra en “corporativas”, tu visión de la cartera ya está desajustada desde el principio. No estás comparando cosas que son iguales.
Utiliza un marco de previsión común para todo el grupo, de modo que cada property siga las mismas definiciones, horizontes de reserva, KPI y reglas de excepción. Las excepciones locales deben formar parte del sistema, no tratarse como casos puntuales. Si un responsable de property detecta un nuevo evento o se da cuenta de que un competidor se está quedando sin existencias antes de lo previsto, debería poder ajustar la previsión y registrar el motivo. Así, la dirección central tendrá una visión clara de qué ha cambiado, por qué ha cambiado y en qué medida ha afectado a la previsión.
A continuación, usa esas mismas reglas compartidas para hacer un seguimiento de los errores en las previsiones y relacionar los errores con las decisiones sobre precios y existencias.
Paso 4: Haz un seguimiento del error de previsión y utilízalo para tomar mejores decisiones sobre los precios
Una vez que tengas en marcha tu proceso de previsión, el siguiente paso es muy sencillo: comprueba hasta qué punto se acerca a la realidad y aprovechar esa diferencia para tomar mejores decisiones sobre los precios.
Haz un análisis semanal y mensual de la precisión de las previsiones
Una vez que hayas aplicado los ajustes de ritmo, combinación y prueba, comprueba si realmente han mejorado la predicción. Anota cada predicción en cinco puntos de control fijos:
- 90 días antes de la llegada
- 60 días antes de la llegada
- 30 días antes de la llegada
- 14 días antes de la llegada
- 7 días antes de la llegada
Después, compara cada uno de ellos con la ocupación real, el precio medio por habitación (ADR) y los ingresos por habitación una vez que haya pasado la fecha de la estancia. El objetivo del informe de errores no es solo ver si la previsión era correcta o no. Es detectar donde suele romperse.
La periodicidad de las revisiones debe coincidir con el plazo de decisión. Vuelve a hacer la previsión para los próximos 14 días cada día, revisa la de 30 a 90 días cada semana y actualiza la previsión de 12 meses cada mes. Además, no te fíes del informe de errores demasiado pronto. Hasta que no tengas al menos 12 semanas de datos, no hay suficiente historial para ver dónde suele fallar el modelo. [3].
Hay algunos patrones que son bastante habituales. Las previsiones excesivamente optimistas suelen deberse a lavado en grupo ya sea porque no estaba bien ajustada o por unas tasas de cancelación elevadas. Subestimar la demanda suele significar que estás llenando las habitaciones demasiado pronto a tarifas más bajas.
Relaciona unas previsiones más precisas con las medidas que generan ingresos
Un error en la previsión debería llevarte a tomar medidas. Si la tendencia indica que la demanda está creciendo más rápido de lo esperado, puede que tengas que subir los tipos de interés, añadir controles de permanencia o proteger el stock antes de que se te escape el pico de demanda. te informo.
Aquí es donde el software puede echarte una mano. Curso de revenue management puede automatizar las actualizaciones de tarifas según el ritmo de reservas y la demanda local actual, y luego enviar esos cambios al PMS o al gestor de canales hasta 24 veces al día. Los hoteles que lo utilizan indican una media de 19% aumento de ingresos y ahorrarte unos 10 horas a la semana sobre la gestión de precios. Te cuento.
Conclusión: El proceso de precisión de las previsiones para 2026 se repetirá
Una vez que el ciclo de revisión está en marcha, la previsión deja de ser algo pasivo y empieza a ser un proceso repetible. Los datos limpios, el ritmo, la combinación de segmentos, las señales de eventos y la revisión semanal de errores son los elementos que hacen que la previsión siga por el buen camino.
Usa un panel de control de análisis e informes de ingresos una para la revisión a nivel de property y otra para las excepciones a nivel de cartera. Después, repite el mismo proceso cada semana; cada ciclo te dará una idea más clara de cómo evoluciona la demanda.
Preguntas frecuentes
¿Con qué frecuencia debería actualizar mis previsiones para el hotel?
Actualiza la previsión de tu hotel diario cuando la demanda cambia rápidamente, y al menos semanal basado en el ritmo y en los datos que figuran en los registros.
Si surge algún evento importante, como un concierto, un partido o la cancelación de una reserva de grupo, actualiza tu previsión enseguida. Durante la temporada alta, revísala más a menudo. En los meses más tranquilos, puedes tomártelo con más calma. RoomPriceGenie puede ayudarte a automatizar estas actualizaciones y reducir el trabajo manual.
¿Qué debo hacer si mi ritmo de reservas cambia de repente?
Actúa rápido y comprueba si el cambio apunta a un tendencia real de la demanda o simplemente una variación a corto plazo al comparar tu ritmo actual con el del año pasado.
Si el ritmo va subiendo, piensa en aumentar tu La mejor tarifa disponible o reducir el stock en los canales con menor audiencia. Si el ritmo se está ralentizando, apuesta por el marketing dirigido o por ofertas exclusivas para móviles en lugar de descuentos generales para todo el público.
Actualiza tus previsiones a menudo – todos los días si el mercado está volátil te informo – utilizando datos de eventos y tarifas en tiempo real.
¿Cómo puedo hacer previsiones precisas con datos limpios limitados?
Empieza por limpiar a diario los datos de tu sistema. Corrige los duplicados, las reservas fantasma, las marcas antiguas de «no se presentó» y los códigos erróneos de cancelación, canal o segmento.
A continuación, elabora una previsión diaria a partir de los datos en los que más confías: el rendimiento histórico, las reservas OTB, la ocupación prevista y la combinación de segmentos o tipos de habitaciones que tengas prevista.
Es útil pensar en esto como si tuvieras que trazar una ruta antes de un viaje por carretera. Si el mapa está mal desde el principio, todo el viaje se complica. Lo mismo pasa con las previsiones. Unos datos de reservas erróneos lo echan todo por tierra a partir de ahí.
Una vez que tengas la base limpia, ve incorporando factores del mercado, como los acontecimientos y la demanda. Actualiza la previsión a menudo y compárala con los resultados reales para que puedas detectar sesgos y corregirlos antes de que se conviertan en una tendencia.