

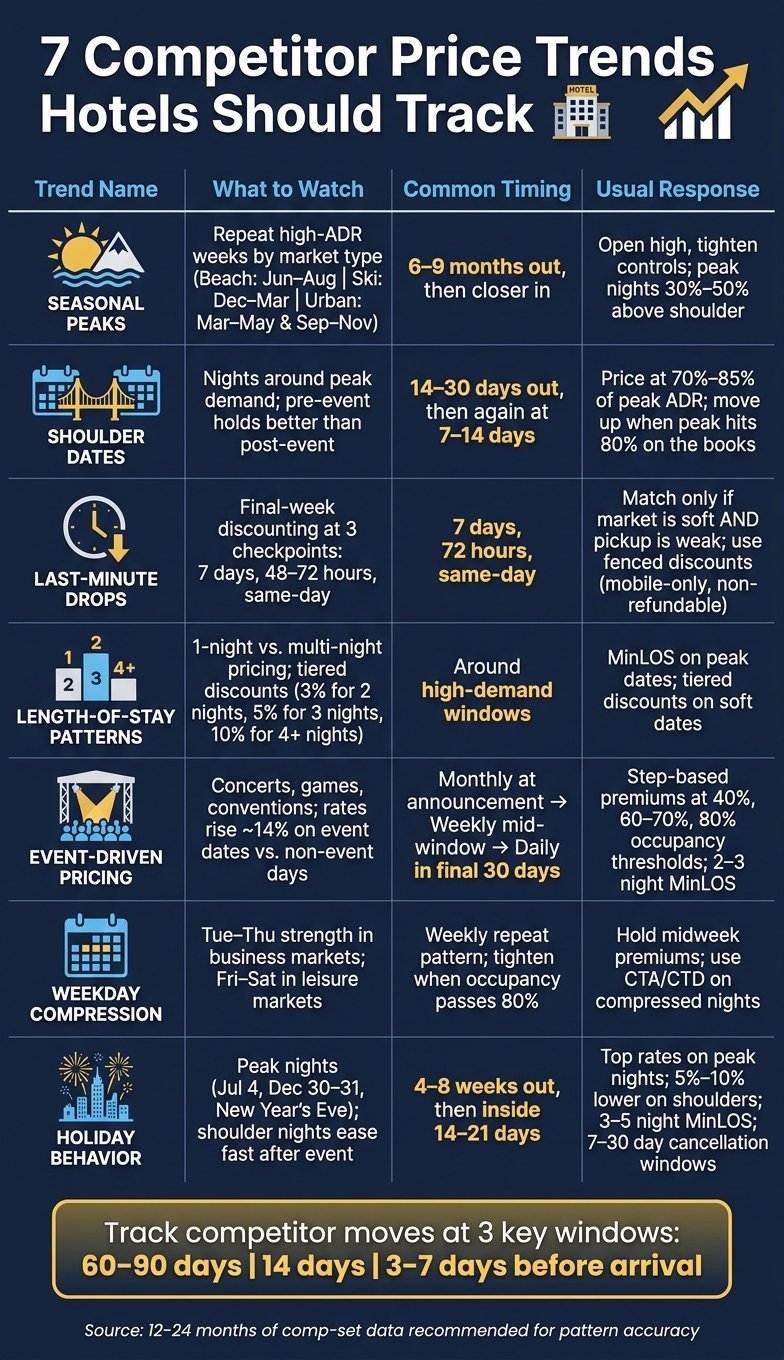
One competitor rate check tells you almost nothing. I’d look at 12–24 months of comp-set data instead, then track the seven patterns that shape hotel pricing: seasonal peaks, shoulder dates, last-minute drops, length-of-stay shifts, event pricing, weekday compression, and holiday behavior.
If I want to price with less guesswork, I focus on a few simple signals first:
- When competitors move rates: often at 60–90 days, 14 days, and 3–7 days before arrival
- Which nights hold the most pricing power: usually Tue–Thu in business markets and Fri–Sat in leisure markets
- How high peak dates sit above normal: often 30%–50% above shoulder nights
- What controls show up with demand: MinLOS, CTA, non-refundable offers, and tighter cancellation terms
Here’s the short version of what matters:
- Seasonal peaks: set your top rate bands early and watch pickup
- Shoulder periods: price just below peak, not at normal levels
- Last-minute drops: cut only if the market is soft and your pickup is weak
- LOS patterns: use longer-stay discounts on soft dates and minimum stays on hot dates
- Events: move early, then step rates up as occupancy builds
- Weekday compression: keep midweek premiums in business-heavy markets
- Holidays: protect the few nights that do most of the revenue work
The Evolution of Hotel Revenue Management and Pricing Strategies | with Chris Anderson
Quick Comparison
| Trend | What I watch | Common timing | Usual response |
|---|---|---|---|
| Seasonal peaks | Repeat high-ADR weeks | 6–9 months out, then closer in | Open high and tighten controls |
| Shoulder dates | Nights around peak demand | 14–30 days out | Price above normal, below peak |
| Last-minute drops | Final-week discounting | 7 days, 72 hours, same-day | Match only on soft nights |
| LOS patterns | 1-night vs. multi-night pricing | Around high-demand windows | Use discounts or MinLOS to optimize your restrictions |
| Events | Concerts, games, conventions | Monthly, then weekly, then daily | Add step-based premiums |
| Weekday compression | Tue–Thu strength | Weekly repeat pattern | Hold midweek premiums |
| Holidays | Peak holiday nights and soft shoulders | 4–8 weeks out or earlier | Protect peak nights, ease shoulders |
I’d treat competitor pricing like a market signal, not a rulebook. The goal is simple: read the pattern, connect it to demand, and make cleaner rate decisions.
What to Look for in Competitor Pricing History
Rate data gets useful when you connect each price move to the reason behind it. Before you get into the seven trends, it helps to know which signals explain why competitor prices change and how far they tend to move.
Baseline rate movement by month and season
Start with your comp set’s normal price range. Look at monthly ADR and occupancy, then split that data by weekday and weekend. For example, a market might sit at $135 on weekdays and $155 on weekends in January, then move to $230 on weekdays and $280 on weekends in July.
The key is to set a seasonal ADR range, not one fixed rate. RoomPriceGenie can do this for you by reading your booking data and mapping demand patterns.
Once you’ve pinned down that seasonal baseline, the next step is simple: watch for the point when competitors begin moving above or below it.
Booking window and timing of competitor rate changes
Competitors usually don’t change rates all at once. They tend to move in stages: up at 60–90 days out if pickup looks strong, up again inside 14 days if demand stays firm, then flat or lower in the last 3–7 days if rooms are still open.
Leisure demand often books 30–90 days in advance. In the U.S., business transient demand tends to cluster inside 14 days, with 40% arriving within four days. That tells you something important: your comp set’s target window shows when you should act, not just how much you should change.
A simple rule works well here:
“If a key Saturday is 15% above baseline at 60 days out and pickup is on pace, follow; if competitors haven’t moved yet but your pickup is running 20% ahead of last year, move first.”
Timing matters. But timing alone won’t tell you which nights deserve the most attention.
Day-of-week pricing differences
Not every night has the same pricing power. In corporate markets, Tuesday through Thursday usually bring the highest ADR. In leisure markets, that usually shifts to Friday and Saturday.
Review ADR and occupancy by day of week, then compare that with what competitors are doing on those same nights. From there, you can build a short set of pricing rules:
- Price Tuesday–Thursday at a premium during corporate season
- Keep a weekend premium in summer leisure season
- Treat Sunday as a value night to help drive longer stays
That kind of pattern gives you a cleaner read on where rate pressure is strongest.
Restrictions that appear with higher demand
Price changes tell only part of the story. When demand goes up, competitors often add controls like minimum length-of-stay (MinLOS), closed-to-arrival (CTA) rules, non-refundable rate fences, and advance-purchase restrictions alongside any rate increase. If a competitor closes arrivals on Saturday but leaves Friday through Sunday open, they’re likely protecting a Fri–Sun stay pattern.
Track those controls just as closely as ADR. On high-demand dates, matching or mirroring them on your side can lift revenue per available room without changing price at all.
Use these signals to read the seven trends below faster.
With those signals in hand, the seven patterns below become easier to spot.
1. Seasonal Peaks in Competitor Rates
Seasonal peaks set the pricing ceiling for the year. These are the weeks when your comp set pushes rates up, tightens controls, and does the same thing year after year. That repeat pattern is what makes these dates so useful to track.
Historical rate pattern
Peak timing changes by market type. Beach and coastal markets usually top out from June through August, and summer Saturdays often carry the highest rates. Ski and mountain properties tend to peak from December through March, with holiday periods and winter demand protected first. Urban and business hotels often post their strongest ADR in spring, from March to May, and again in fall, from September to early November. In those markets, conventions and corporate travel matter as much as, or more than, the weather. [7][9]
| Market type | Typical peak window | Primary demand driver |
|---|---|---|
| Beach/coastal | June–August | Summer leisure travel |
| Ski/mountain | December–March | Holiday and winter recreation |
| Urban/business | March–May, September–early November | Conventions, corporate travel |
One thing to watch: demand peaks and ADR peaks don’t always hit at the same time. In many U.S. markets, demand is highest in July or August, but ADR may peak at a different point. San Diego shows this clearly. Median RevPAR vs TRevPAR vs GOPPAR comparisons show that RevPAR peaks at $323 in July and falls to $149 in January, which shows just how far summer pricing can outpace the rest of the year in a leisure market. [9]
Typical competitor timing
Peak dates tend to get loaded earlier and fill faster than standard dates. Competitor pricing often moves in stages: smaller increases 60–90 days out, steeper jumps at 21–30 days as pickup starts building, and then a leveling off once compression kicks in.
On known peak dates, waiting for the comp set to move first can cost you. By the time they shift, demand may already be there.
Recommended pricing response
Set peak rates 6–9 months ahead, then adjust based on pickup pace. In some markets, peak nights can hold premiums of 30%–50% above shoulder-night rates. It also helps to watch the weeks on either side of the peak. That’s usually where you see the first signs of softening, and it gives you a cleaner view of how long the high-rate window can last.
Key controls or restrictions
During peak periods, rate alone usually isn’t enough. Competitors often pair higher pricing with tighter stay rules and booking conditions to protect inventory for higher-paying guests.
- 2- or 3-night minimum stays on peak weekends
- Advance purchase requirements
- Tighter cancellation windows
- Closing discounted rate plans
- Restricting low-rate availability
If your competitors are using these controls and you aren’t, you may leave high-demand inventory open to lower-rated bookings. Matching those moves can help you hold peak-night rooms for full-rate demand.
2. Shoulder Period Pricing Around Peak Dates
Shoulder dates are the nights right before or after a peak. Think of the Thursday before Memorial Day, the Monday after a big convention, or the dates around a concert, festival, or holiday weekend. It helps to track these nights on their own because they often behave differently from the peak itself. And they matter year after year, since the same events and calendar patterns tend to come back.
Historical rate pattern
Shoulder nights often price 10%–30% above normal levels, but still sit 10%–20% below the peak. In plain terms, they get a lift, just not as much as the main event dates.
Pre-event shoulders usually hold up better than post-event shoulders. Once the main event ends, demand can drop fast. A sports-event study found that the 2 days after the race were associated with significant decreases in hotel room rentals.[14] For urban hotels, there’s another pattern to watch: if the peak lands on convention weekdays, the weekend nights around it often become the shoulder dates.
Typical competitor timing
Many competitors leave shoulder dates close to standard rates until peak nights are about 70%–80% booked. Then they start moving. A common pattern is to push shoulder rates up 5%–15% at 14–30 days out, and then push again at 7–14 days as compression starts to build.
Recommended pricing response
A good starting point is to set shoulder rates at 70%–85% of peak ADR. From there, move them up when peak nights hit 80% and then 90% on the books.
The upside is there. CoStar data showed that shoulder-day RevPAR in the U.S. grew 5.1% in one measured period, with ADR up 3% and occupancy up 1.2 percentage points.[13] As these nights fill, they’re often the first place where competitor pricing starts to jump before any last-minute dip shows up.
Key controls or restrictions
Use MinLOS with care. On pre-event shoulders, require stays that run through the peak. On post-event shoulders, ease that rule so guests can add a night without friction.
As occupancy builds, close out deep-discount rates. At the same time, keep a small set of value-added packages in place. That can help protect ADR while still giving price-sensitive guests a reason to book.
3. Last-Minute Competitor Rate Drops
After shoulder dates, the next signal shows up in the final week before arrival.
Last-minute rate drops matter most when pickup starts to slow. The key is to watch why competitors are dropping rates, not just the fact that they did. Are they trying to fill soft nights? Or are they staying firm because rooms are getting scarce?
Historical rate pattern
On weak nights, competitors often keep rates steady until about 7–14 days out. Then they cut in the final 3–7 days to move unsold rooms. On strong nights, the pattern usually flips: they hold rates flat or push them higher as inventory shrinks. Soft weekday nights also tend to drop earlier than weekend nights.[15]
Typical competitor timing
Keep an eye on three checkpoints:
7 days out
48–72 hours out
Same-day
These are the points when most last-minute pricing moves show up. Same-day changes usually point to cancellations or live occupancy shifts.
Recommended hotel pricing strategies
Match the market only when the drop is broad and your pickup is weak. If not, stay above the floor and move toward the middle of the rate band, not the bottom.
For example, if competitors move from $160 to $129, you might move from $169 to $139 and add something like breakfast or late checkout. That helps protect ADR while still keeping you in the game. On strong nights, hold your rate or step it up instead of discounting.
“Don’t wait until you’re sold out to raise your rates. Get ahead of the pickup.” – Natalie Reiter, Director of Revenue Management Success, RoomPriceGenie
Key controls or restrictions
On weak nights, use fenced discounts such as mobile-only, member-only, or non-refundable rates. On strong nights, tighten controls with minimum stays, shorter cancellation windows, and less discounted inventory in market. Set a rate floor tied to your cost and margin.
The next pattern to watch is whether competitors price one-night stays differently from longer stays.
4. Length-of-Stay Pricing Patterns
Watch how competitors price short stays versus longer ones. This tells you a lot about market pressure. When demand is light, longer stays often get discounted. When demand tightens, those same rules often shift toward protecting inventory instead of giving price breaks.
Historical rate pattern
A common setup is a tiered discount model: a small discount for 2-night stays, a bigger one for 3-night stays, and deeper discounts for stays of 7+ nights [1]. Around high-demand weekends or major local events, that pattern can flip. Instead of discounting, competitors may add restrictions and require a three-night minimum so they don’t leave one-night gaps around peak dates [2]. When stay rules get tighter, it’s usually a sign that demand is strong enough to favor longer bookings.
Recommended pricing response
If longer stays keep beating short stays, add length-of-stay pricing [3]. Use MinLOS on your peak nights to favor multi-night bookings. Then, during softer periods, use tiered discounts to pull in longer reservations without cutting too deep all at once – for example, a discount for 3-night stays and a bigger one for stays of 7 nights or more [1]. If competitors are rewarding longer stays, mirror that structure on the nights that matter most.
Key controls or restrictions
Use MinLOS on high-demand dates to protect peak nights. On softer dates, use tiered discounts to drive longer stays without lowering your base rate. These stay-length controls usually tighten fastest around concerts, conventions, and holiday weekends.
5. Event-Driven Competitor Pricing
Events can throw normal seasonality and booking patterns out the window. A big concert, a citywide convention, or an NFL game can change a market fast. And hotels in the comp set often start pricing for those dates months ahead of arrival. That’s why event calendars are one of the clearest repeat signals in competitor rate history.
Historical rate pattern
Research across sporting events shows hotel rates rise about 14% on event dates versus non-event days . You can master these revenue management courses to better predict such shifts [16][17]. Bigger events tend to push rates even higher.
For multi-day events like festivals or conventions, competitors often move rates in stages. They may open at 30%–40% above normal weekend BAR, then push rates higher again as each booking threshold is hit. Single-night events like NFL games or concerts usually follow the same pattern: set an early premium, then keep moving up as inventory gets tighter.
Typical competitor timing
Watch event dates on a steady rhythm:
Monthly when events are first announced
Weekly during the mid-booking window
Daily in the final 30 days
Recommended pricing response
Base event pricing on prior-year ADR and current comp-set rates. Then move up in planned steps as booked occupancy passes 40%, 60%–70%, and 80%.
For new or first-time events, demand can be harder to read. In those cases, open at a lighter premium of 10%–20% above baseline and let live pickup and market movement tell you when to go higher.
Key controls or restrictions
For multi-day events, a MinLOS of 2–3 nights on peak dates helps protect higher-value multi-night stays and cuts down on one-night gaps that are tough to sell later. For single-night events, a 2-night minimum across the event window can lift total revenue and reduce churn.
Non-refundable rates make sense when guests tend to book far ahead. They help lock in committed demand and lower cancellation risk. If shoulder nights start showing strong pickup, those dates can also hold a 10%–25% premium.
6. Weekday Compression in Competitor Rates
Event-driven jumps aren’t the only thing to watch. In some markets, this pattern shows up every single week.
In business-heavy urban areas, weekday compression often pushes Tuesday through Thursday above Sunday and Friday. That gap matters. It shows you which nights can support a higher price and which nights may need a lower starting rate.
Historical rate pattern and competitor timing
In these markets, competitors tend to keep Tuesday–Thursday rates above Sunday and Friday on a steady basis. Tuesday and Wednesday often sit at the top of the weekly rate curve.
Once projected occupancy moves past 80%, competitors often push midweek rates higher and tighten availability.
Recommended pricing response
When the comp set shows compression, price Tuesday–Thursday above Sunday and Friday.
RoomPriceGenie can automate those midweek changes using live pickup and shifts in competitor rates.
Key controls or restrictions
Use CTA and CTD on compressed midweek nights to protect the strongest demand.
7. Holiday Demand Pricing Behavior
Holiday pricing tends to act a lot like event pricing: a small number of nights do most of the heavy lifting, and rates can drop off fast around them. Memorial Day, Fourth of July, and Labor Day usually bring strong leisure demand in beach, lake, and mountain markets. Thanksgiving, Christmas, and New Year’s are more split. Resort markets often see heavy compression, while urban business hotels can see softer demand.
What matters most is pretty simple: know which nights spike, which shoulder nights ease off, and which controls show up first.
Historical rate pattern
Summer long weekends follow a pretty consistent shape. Rates usually peak from Friday through the holiday night, then ease on shoulder nights like Thursday and the Monday after.
The Fourth of July is even more concentrated. When July 4 falls on a Friday, CoStar data shows occupancy on that night reaching 71.7%, while ADR rose 3.4% year over year. On July 3, ADR fell 7.8%[22].
Winter holidays behave differently. In resort markets and high-demand urban markets, Christmas and New Year’s demand clusters around December 26–31, with the highest rates on December 30–31. Then rates drop sharply starting January 1–2.
Thanksgiving has its own rhythm. Demand usually centers on the Wednesday before and the Friday–Saturday after the holiday. The holiday night itself is often softer. The average pricing data points in the same direction: the strongest rates sit around the nights with the most compression. Thanksgiving averaged $189 per night, a 13% year-over-year increase, and Christmas averaged $218 per night, a 32% increase[21].
Typical competitor timing
Summer holidays often move first 4–8 weeks out, then move again inside 14–21 days as pickup builds. Christmas and New Year’s usually open earlier with premium rates and MLOS, then tighten again in the final 30 days.
That timing matters because it shows when to create a bigger spread between peak nights and shoulder nights, instead of pricing the whole holiday period too evenly. Implementing diverse pricing strategies ensures you capture maximum value during these high-demand windows.
Recommended pricing response
Protect peak nights like July 4, Dec. 30–31, and New Year’s Eve with your top rates. Then use pricing that is 5%–10% lower on shoulder nights to fill gaps without cutting into core ADR.
RoomPriceGenie can provide automated pricing for hotels to handle those adjustments using your holiday history and live demand.
Key controls or restrictions
At many resorts, 3–4-night minimums are common for Memorial Day, July 4, and Labor Day weekends[18][19]. The goal is simple: stop one-night stays from blocking longer, higher-value bookings.
For New Year’s Eve and Christmas week, competitors often shift to non-refundable rates and 7–14-day cancellation windows, instead of the usual 24- to 48-hour terms[23][20]. When pickup is strong and occupancy is getting tight, those controls tend to show up early.
The table below pulls the main holiday signals into one place.
Holiday | Peak Night(s) | Typical Competitor MLOS | Cancellation Window |
|---|---|---|---|
Memorial Day | Friday through Monday | 3–4 nights | 7–14 days |
Fourth of July | July 4 and surrounding weekend nights | 3–4 nights | 7–14 days |
Labor Day | Friday through Monday | 3–4 nights | 7–14 days |
Thanksgiving | Wednesday before, Friday–Saturday after | 3–5 nights | 7–14 days |
Christmas | December 26–31 | 3–5 nights | 14–30 days |
New Year’s Eve | December 30–31 | 3–5 nights | 14–30 days |
Comparison Tables for Faster Rate Decisions
Use these tables as a quick reference when you need to turn trend history into a rate move. Look at the rate band, booking window, and the controls that have the biggest effect.
Seasonal peaks table
Start by sorting dates into demand tiers. This process is easier when you use hotel demand forecasting tricks to ensure accuracy.
Season / Tier | Pricing Logic | Occupancy Context | Typical Comp-Set Move | Best Controls |
|---|---|---|---|---|
Low | 15% below base | Quietest weeks and slow midweek nights | Flat or discounting | Keep discounts open; no stay restrictions |
Standard | Base rate | Average shoulder-season nights | Minimal movement | Hold rate and watch pace |
High | Base rate + 25% | Strong weekends and school breaks | Above baseline | Narrow discounts; consider MinLOS |
Peak | 50% above base | Major holidays, events, and compression dates | Full compression | Tighten cancellation and protect premium dates |
Use this table to place each period into a rate band, not to assign one fixed rate. That distinction matters. A High period still gives you room to move based on pickup, comp-set behavior, and how close you are to arrival.
Length-of-stay pricing table
Independent hotels commonly use LOS discounts like 3% for 2-night stays, 5% for 3 nights, and 10% for 4+ nights, especially during shoulder and low seasons.[24]
LOS Tier | Competitor Discount vs. BAR | Booking Value Impact | Recommended Action |
|---|---|---|---|
1 night | None | Lowest total room revenue; highest cost per stay | Hold |
2 nights | About 3% | Good fit for typical weekend demand | Match |
3 nights | About 5% | Helps fill shoulder nights | Match |
4+ nights | About 10% | Lower turnover cost; stronger occupancy support | Beat slightly if midweek is soft |
This table works best when you treat LOS pricing like a dial, not an on/off switch. If midweek demand is lagging, a slightly better 4+ night offer can help pull in longer stays without cutting your whole rate structure.
Event pricing timeline table
Use this table to avoid two common event pricing mistakes: underpricing right after an event is announced, and panic discounting in the final week.
Stage | Timing | Competitor Rate Movement | Best Controls |
|---|---|---|---|
Announcement | 6–12 months out | Some lift rates immediately; others hold flat | Set an initial premium over baseline and review group blocks |
3 months out | ~90 days | Cancellation policies tighten and MinLOS appears | Introduce or extend MinLOS and narrow discounted LOS tiers |
6 weeks out | ~42 days | Further ADR increases or targeted discounts if pickup is soft | Refine rate fences, limit deep LOS discounts, and calibrate overbooking |
0–14 days out | Final 2 weeks | Hold high or use constrained discounts | Tighten cancellation and protect premium room types |
Check this timeline before compression sets in. The goal is simple: move early, then tighten control as the booking window closes.
Weekday compression table
Business and leisure demand usually don’t peak on the same nights, so rate strategy often needs to shift by day of week.
Day | Occupancy Context | Comp Set Strength | Target Pricing Position |
|---|---|---|---|
Monday | Business demand building; moderate occupancy | Weak to Normal | Base rate |
Tuesday | Strong business demand | Normal to Strong | Base rate plus a modest premium |
Wednesday | Often the highest compression day in U.S. business markets | Compressed | Base rate plus a larger premium; close discounted channels |
Thursday | Shoulder between business and leisure | Normal to Strong | Slight premium; monitor pickup |
Friday | Leisure demand starts to take over | Strong in leisure markets | Higher rate in leisure markets |
Saturday | Peak leisure night in most U.S. markets | Compressed | Highest weekend rate; use minimum length of stay if needed |
Sunday | Softer drive-home night | Weak to Normal | Base rate or selective discount |
This table is a fast reality check. A hotel can look healthy for the week as a whole but still leave money on the table on Wednesday or Saturday. Day-level pricing helps you avoid that trap.
Conclusion
Historical patterns matter more than one-off rate checks. Those tables turn past performance into a simple rule: price the repeat pattern, not the isolated rate. Each pattern helps you set rate floors, ceilings, and stay restrictions. And the seven patterns only work when you read them together. A holiday weekend and a slow shoulder night shouldn’t follow the same playbook.
Start with a tight comp set and 12–24 months of history. That data is only useful if you’re comparing the right hotels in the same submarket. Once the pattern becomes clear, automation can handle the day-to-day work. Tools like RoomPriceGenie can automate rate updates using your booking data and live demand.
The job is simple on paper: read the pattern, then price with confidence.
FAQs
How do I choose the right comp set?
Choose a comp set made up of true substitutes. That means hotels in a similar location or submarket, with a similar star rating, property type, guest appeal, key amenities, and comparable guest ratings.
Your set should include direct competitors and rate leaders. In most cases, that means 5–10 properties, weighted by how closely each one matches your hotel.
Use competitor pricing as a reference point, not the whole story. Check those rate moves against your booking pace and demand before you act. Then review the comp set quarterly so it still reflects the market you’re actually competing in.
Which trend should I track first?
Start with lead time: the number of days between booking and check-in. Look back at 12 to 24 months of reservation history, then sort bookings into time windows like same-day or 31–90 days before arrival.
That gives you a clearer view of how demand shifts across each booking window. In plain English, you can line up your rates with when people tend to book instead of dropping prices too soon. That matters most for last-minute bookings, which can still bring in a premium. From there, layer in day-of-week patterns and seasonal trends.
When should I raise rates first?
Increase rates based on your booking pace, not after competitors move or rooms start disappearing.
A simple rule: move rates up when pickup is running well ahead of the same time last year – for example, 30% ahead. Do the same when confirmed local events, competitor price jumps, or nearby sellouts point to stronger demand.
That way, you’re acting on what the market is telling you now instead of playing catch-up later.